View object loading an unnecessary no. of rows in the memory can be a strong reason for causing performance-related issues in oracle ADF applications. There are many scenarios where the rows are being loaded in the memory unintentionally. As too many rows are loaded into the memory this will lead to slow application performance.
There can be many reasons due to which this is happing.
b. Each has different usage depending on the use case.
c. To explain the point above I will only talk about two, i.e. af:InputListofValues (Lens Lov) and af:selectOneChoice (Dropdown LOV).
d. af:InputListofValues(Lens LOV): These LOV's are used where the user has to select a value from a very large no. of options. Users can narrow down the list by search and filter and then select the record. This type of LOV loads a small no. of rows (Max 10 Default Query Limit) in the system List of Values Properties in the ViewObject.
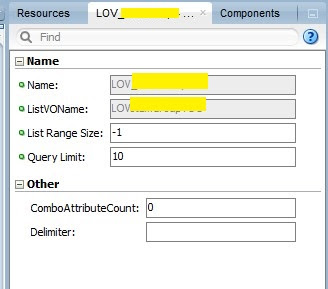
e. af:selectOneChoice (Dropdown LOV): These LOV's are used where the user has to select the value from a small no. of Options lets say 5 to 10. In this case, all the records are displayed on the page and there is not Query Limit by Default.

f. So if during the implementation if in case if no. of values is large and single selection Lov is used then a large no. of rows will be loaded in the memory and will lead to slow application loading.
The default range of a view object if dropped on the Page is 25 that means 25 rows will be loaded into memory if that view Object is page is rendered. If the range size is changed to -1 than all the rows in the view object will be loaded in the memory on the first request and if there are large no. of rows returned from the view object Query then it will take time to load. As per my experience, it is never advised to set the range size of a table to -1.

b. These are in-memory filtration, i.e. first all the rows will be loaded in the memory and then filtration will be done.
c. But this filtration is done in the memory, and if the is being done on a view object which has a large no. of rows then all the rows will be first loaded into the memory which will lead to slow application processing.
How to enable the logger? I have mentioned the steps to enable the logger in this post ->

If you have any questions or queries related to the above blog, please feel free to ask. :)
There can be many reasons due to which this is happing.
1. The wrong List of Values used.
a. There are several types of LOV's that are defined in ADF.b. Each has different usage depending on the use case.
c. To explain the point above I will only talk about two, i.e. af:InputListofValues (Lens Lov) and af:selectOneChoice (Dropdown LOV).
d. af:InputListofValues(Lens LOV): These LOV's are used where the user has to select a value from a very large no. of options. Users can narrow down the list by search and filter and then select the record. This type of LOV loads a small no. of rows (Max 10 Default Query Limit) in the system List of Values Properties in the ViewObject.

e. af:selectOneChoice (Dropdown LOV): These LOV's are used where the user has to select the value from a small no. of Options lets say 5 to 10. In this case, all the records are displayed on the page and there is not Query Limit by Default.

f. So if during the implementation if in case if no. of values is large and single selection Lov is used then a large no. of rows will be loaded in the memory and will lead to slow application loading.
2. Range of Table set to -1 which means all the rows that are loaded from view object query.
The default range of a view object if dropped on the Page is 25 that means 25 rows will be loaded into memory if that view Object is page is rendered. If the range size is changed to -1 than all the rows in the view object will be loaded in the memory on the first request and if there are large no. of rows returned from the view object Query then it will take time to load. As per my experience, it is never advised to set the range size of a table to -1.

3. Use of getFilteredRows or RowQualifier for in-memory filtration in the Application.
a. getFilteredRows or RowQualifier are used for filtering the rows of the view object programmatically.b. These are in-memory filtration, i.e. first all the rows will be loaded in the memory and then filtration will be done.
c. But this filtration is done in the memory, and if the is being done on a view object which has a large no. of rows then all the rows will be first loaded into the memory which will lead to slow application processing.
How to identify the view object which is loading huge no. of Rows.
ADF shows all the model layer activities using oracle.jbo logger and by setting it to finest we can see minute details of the processes that are being executed when the application is running.How to enable the logger? I have mentioned the steps to enable the logger in this post ->
Now run the application and open the logger window and while application is loading see the log. It will show the queries which are being executed. If the log is stuck at some query and the log shows something like this.

The line "$$added root$$ id=-2" means that the Application is loading all the rows of the view object of the above query.
Solution.
1. First identify the view object or Lov which is loading large no. of rows.
2. Check the references of the view object, where they are used and how they are used.
3. Check if the view object is used for in-memory filtration or not. If yes, then check how many rows are being loaded into memory and why they are being loaded in the memory. Maybe there is any issue in implementation logic due to which this is happening.


